
A cabinet refacing company generated $1.87M in tracked revenue in one year from Google and Bing ads
How a small trial project grew into a growth partnership across several markets, with ad spend at 8% of revenue.
- Service
- Kitchen refresh: cabinet refacing
- Location & channels
- USA: Illinois & Wisconsin
- Google Ads
- Microsoft Ads
- in tracked revenue in one year
- $1.87M
- leads at an average cost of $264
- 601
- ad spend as a share of revenue
- 8%
- revenue growth from Q1 to Q4
- +575%
- Locations
- Illinois & Wisconsin, USA · 4 showrooms
- Starting budget
- under $3,000 a month
- Budget by Q4
- over $30,000 a month
- Channels
- Google Ads, Microsoft Ads
About the client
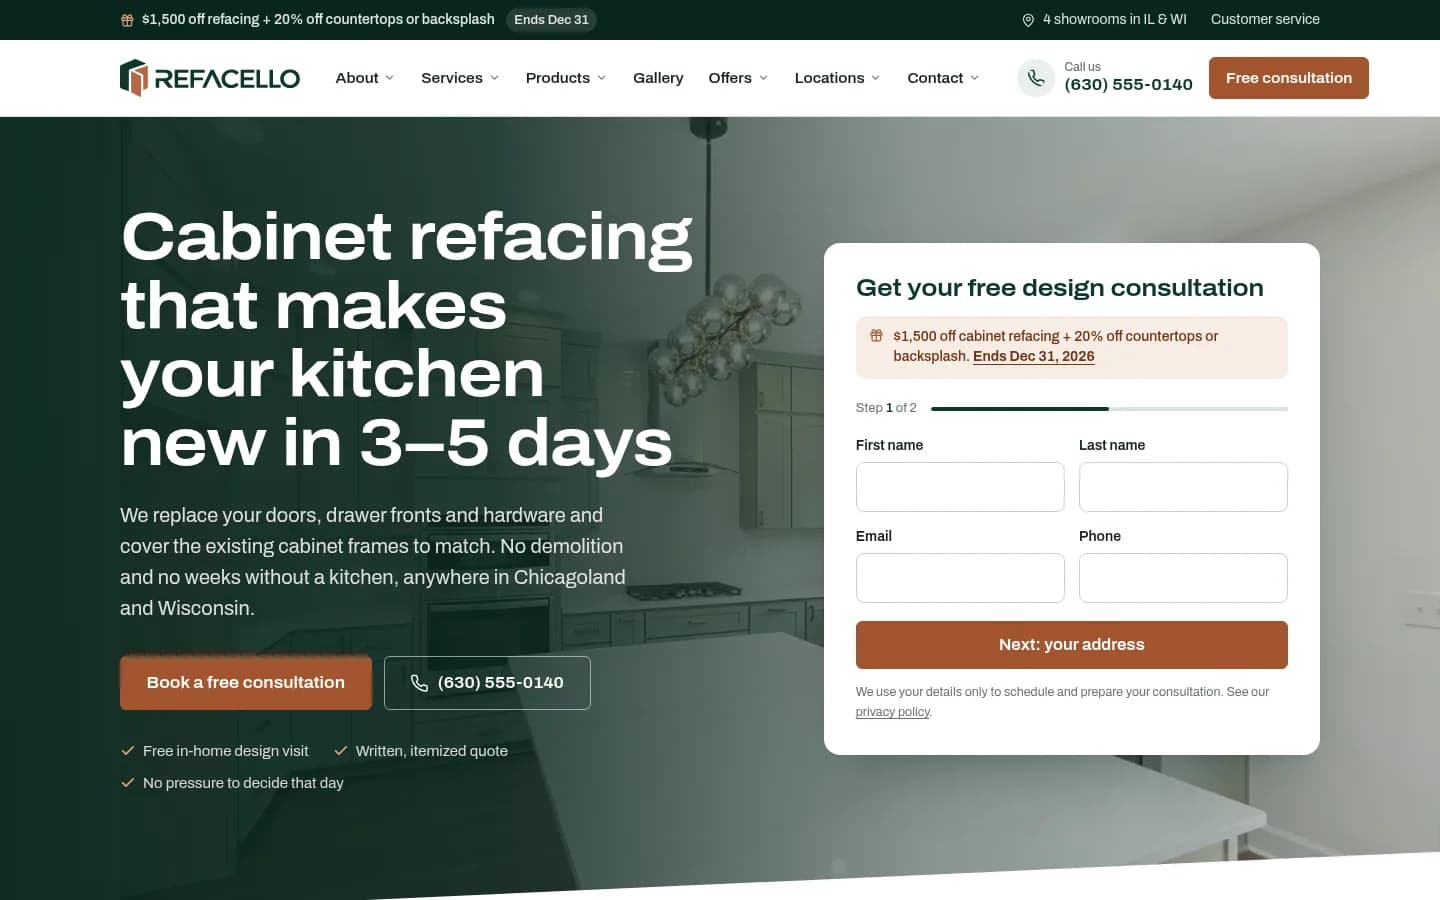
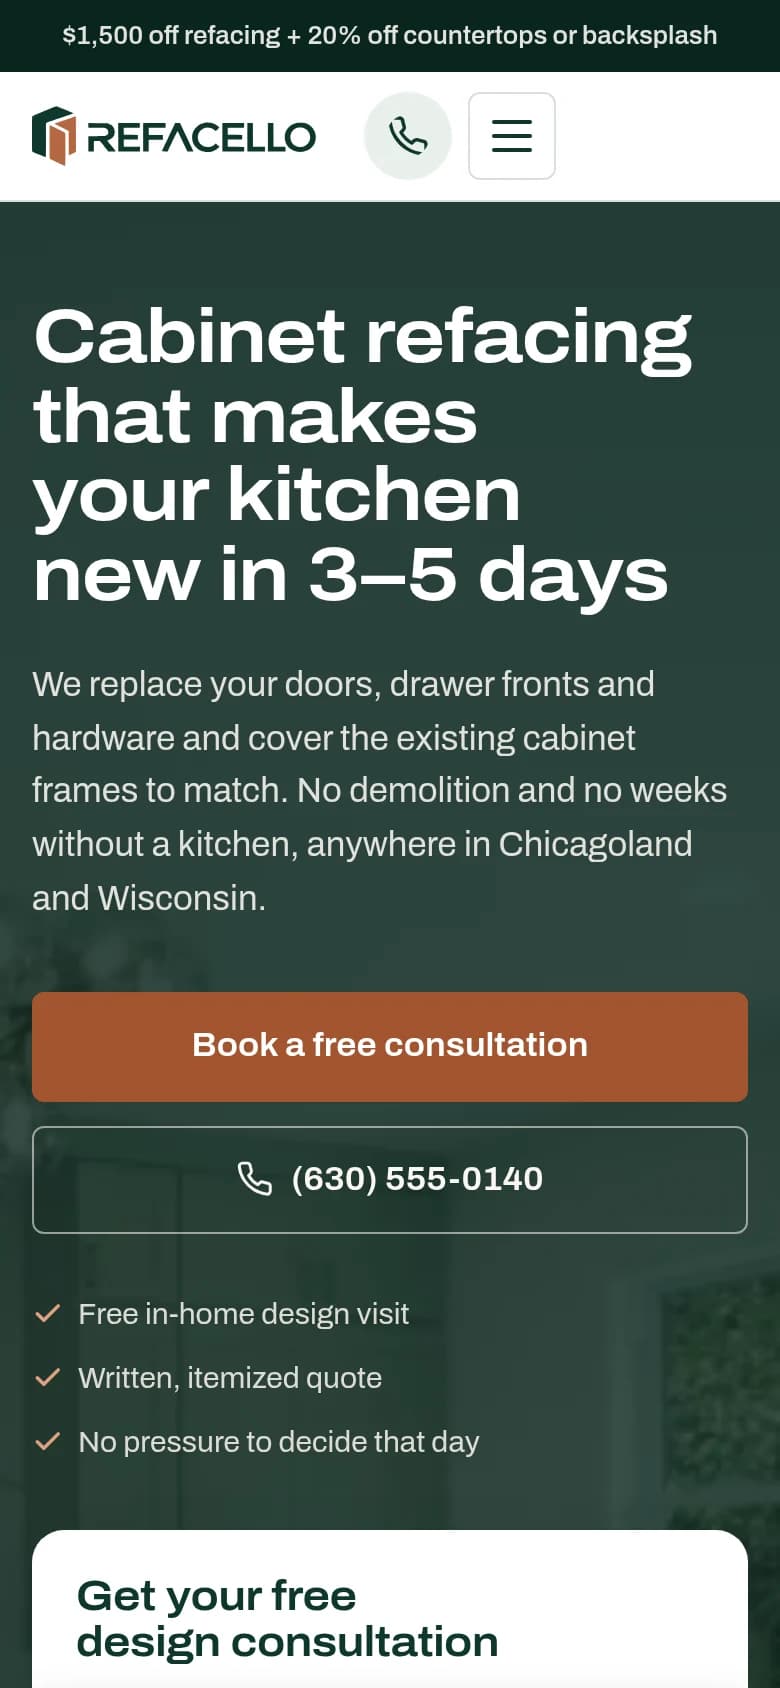
A fast-growing company that refreshes kitchens for homeowners, putting new doors and fronts on existing cabinets, in several major U.S. markets. A strong product, a capable sales team and a real plan to expand into new cities. Only one thing was missing: a marketing partner they could trust.
Before that, the company had worked with several agencies across scattered channels and had no clear picture of what actually drove revenue. The request was simple: prove your value month after month, and we'll grow together.
The challenge: leads came in, but nobody knew what worked
Lead volume and quality
Leads were inconsistent in both volume and quality. Sales couldn't rely on a steady pipeline, and too many inquiries never turned into real deals.
No visibility or attribution
The budget was spread across vendors and channels, with no way to tell what drove revenue and what just burned money.
No measurable ROI
The company was investing in marketing without knowing what it got back.
There were no formal goals at the start. The brief was: show us what's possible, and the budget will follow the results.
The solution
- 01
The budget grows only after revenue does
Instead of spreading the budget across channels from day one, we built the strategy on Google Ads, where purchase intent is highest and attribution is clearest, and let the numbers decide when and how to scale.
- Step-by-step budget growth. We started under $3,000 a month and added more only when lead quality and revenue justified it. By Q4 the budget passed $30,000 a month, because the results earned it.
- Full-funnel tracking. Every lead was tracked from the first click to closed revenue, so the owner could see the path from an ad dollar to a signed job.
- New market launches. As the first location grew, we built a playbook for launching new markets fast, including taking over a new market from another agency mid-campaign without losing momentum.
- 02
Microsoft Ads (Bing), despite the client's initial doubts
Bing wasn't in the original plan, and the client had doubts. We made the case with data, and it became one of the most effective decisions of the whole project.
- leads on $11,988 in ad spend
- 103
- cost per lead
- $116
- valid leads, a higher share than on Google
- 84%
- in revenue for every $1: $472,031 with ad spend at 2.5% of revenue
- $39
- 03
A strategic voice at the table
Over the year, we became the people the owner checks marketing decisions with, well beyond typical PPC:
- New channels: how AI search tools like ChatGPT are changing the way homeowners find contractors, and what to do about it now.
- Trade shows: whether and how to invest in them for leads and brand.
- Market expansion: which cities to open next, in what order, and how to repeat what already works.
- In-house team or agency: when the owner considered moving marketing in-house, we had an honest conversation about what was best for the business.
Results: $1.87M in revenue with ad spend at 8%
The longer the project ran and the more trust grew, the better the results got.
- Q1
- Revenue: $143,784, ad spend: $10,982
- Q2
- Revenue: $290,094, ad spend: $15,755
- Q3
- Revenue: $464,189, ad spend: $38,284
- Q4
- Revenue: $970,294, ad spend: $93,612
Q4 revenue was 6.7 times Q1 revenue. Part of the growth came from new markets, as the playbook was launched in new cities. Over the year, ads cost about 8% of revenue on average (ad budget divided by revenue).
Lead quality held as volume grew
Leads
601
$264 per lead
Valid leads · 71%
429
Appointments · 46%
198
Closed jobs
63
≈ $29,657 in revenue per job
The share of valid leads stayed at 71%, even as the monthly budget grew 10 times.
Microsoft Ads: the efficiency leader
Google brought most of the volume, but Bing became the most efficient channel: $472K in revenue on about $12K in ad spend, ad spend as a share of revenue about 4 times better than Google's, and 8 out of 10 leads worth pursuing.
Beyond the numbers
A seat at the strategy table
We help make decisions instead of hearing about them after the fact.
Confidence to expand
Every ad dollar is tied to revenue, so the owner makes decisions about new markets based on data. The question changed from “Is our marketing working?” to “How fast do we want to grow?”
A repeatable playbook
Every new location starts from a proven setup, and what we learn in one market helps the next one.
Next: deeper offline conversion tracking, more locations, and adapting to the next shift in how people search.
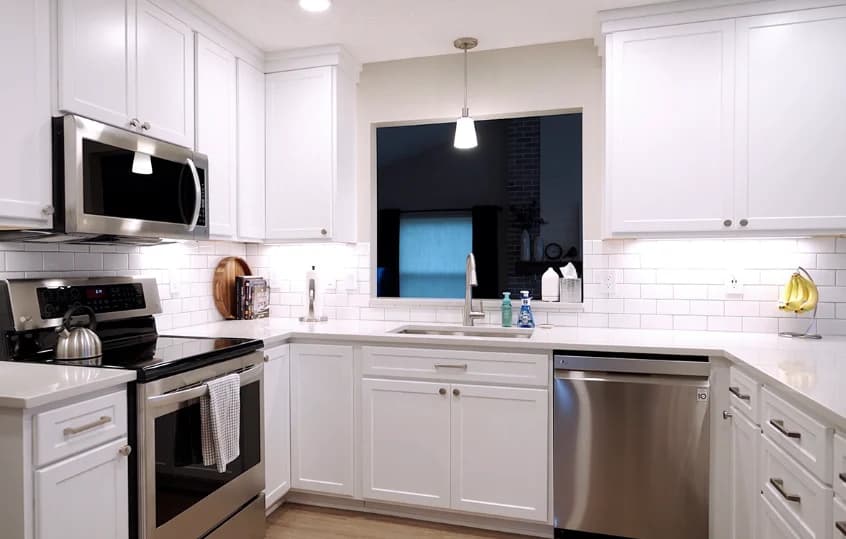
Kitchen refresh: cabinet refacing
More cases


Heating, ventilation, AC & water supply
- Germany: Minden
- Google Ads
- Facebook Ads
€48
per qualified lead
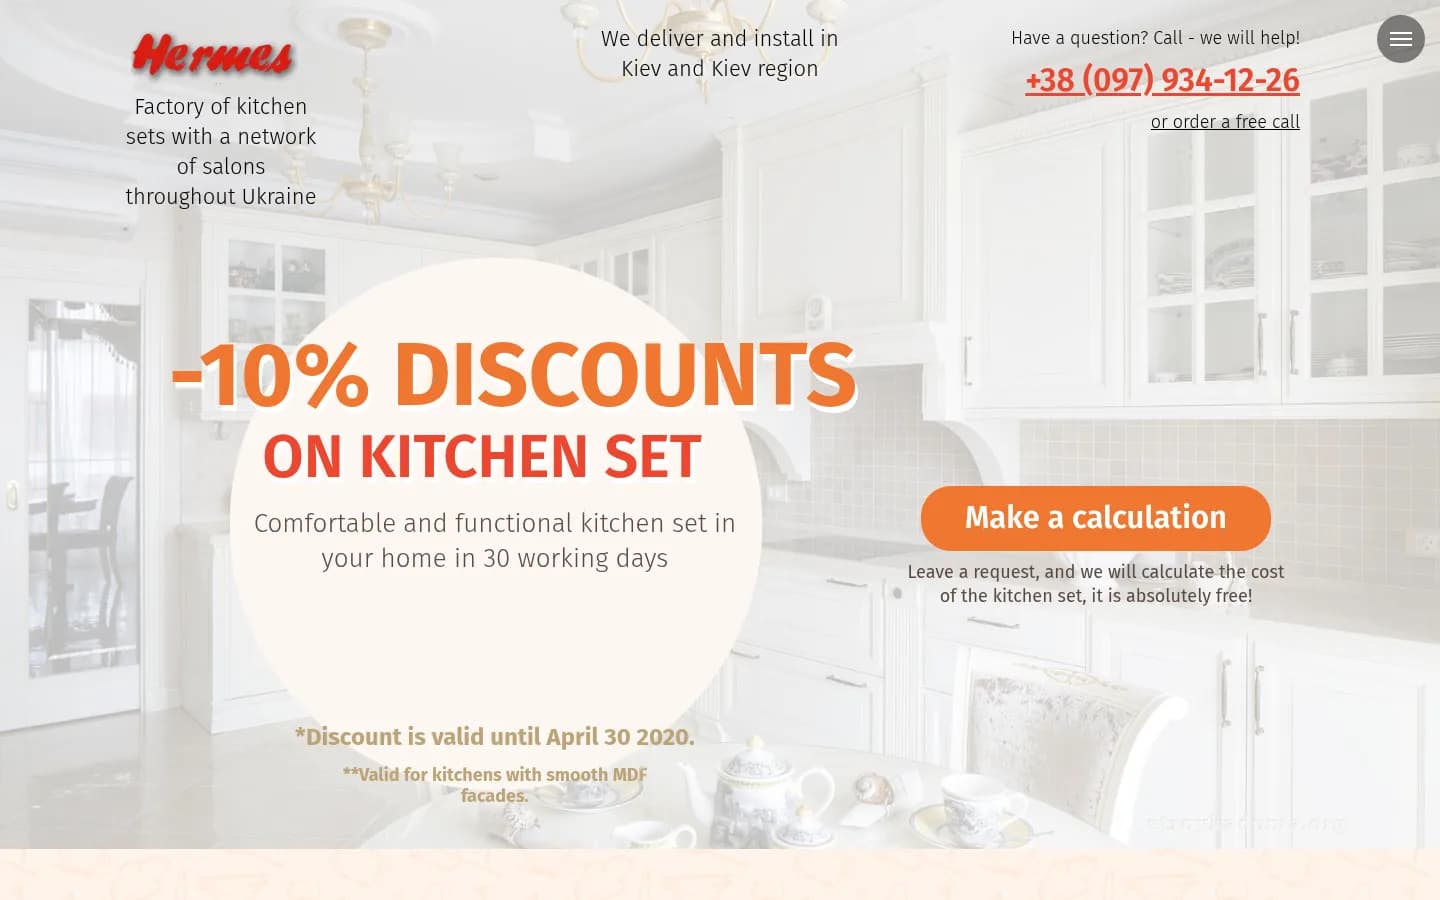


Custom kitchens
- Ukraine: Kyiv
- Google Ads
- Facebook Ads
$8
per qualified kitchen lead



Architecture & interior design
- Ukraine: Kyiv
- Google Ads
- Facebook Ads
$12
per lead, down from $98
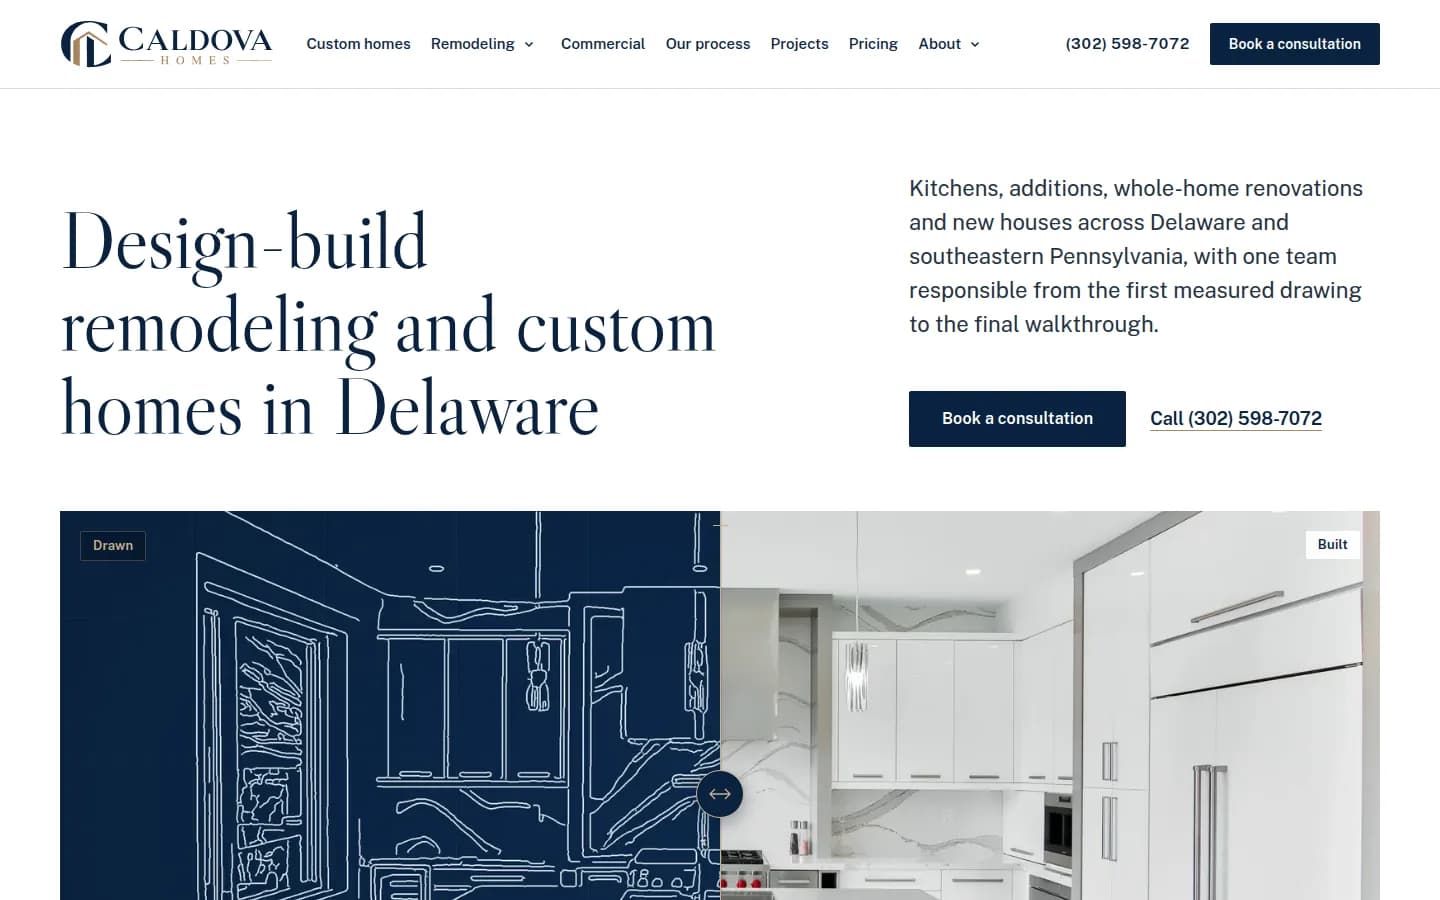
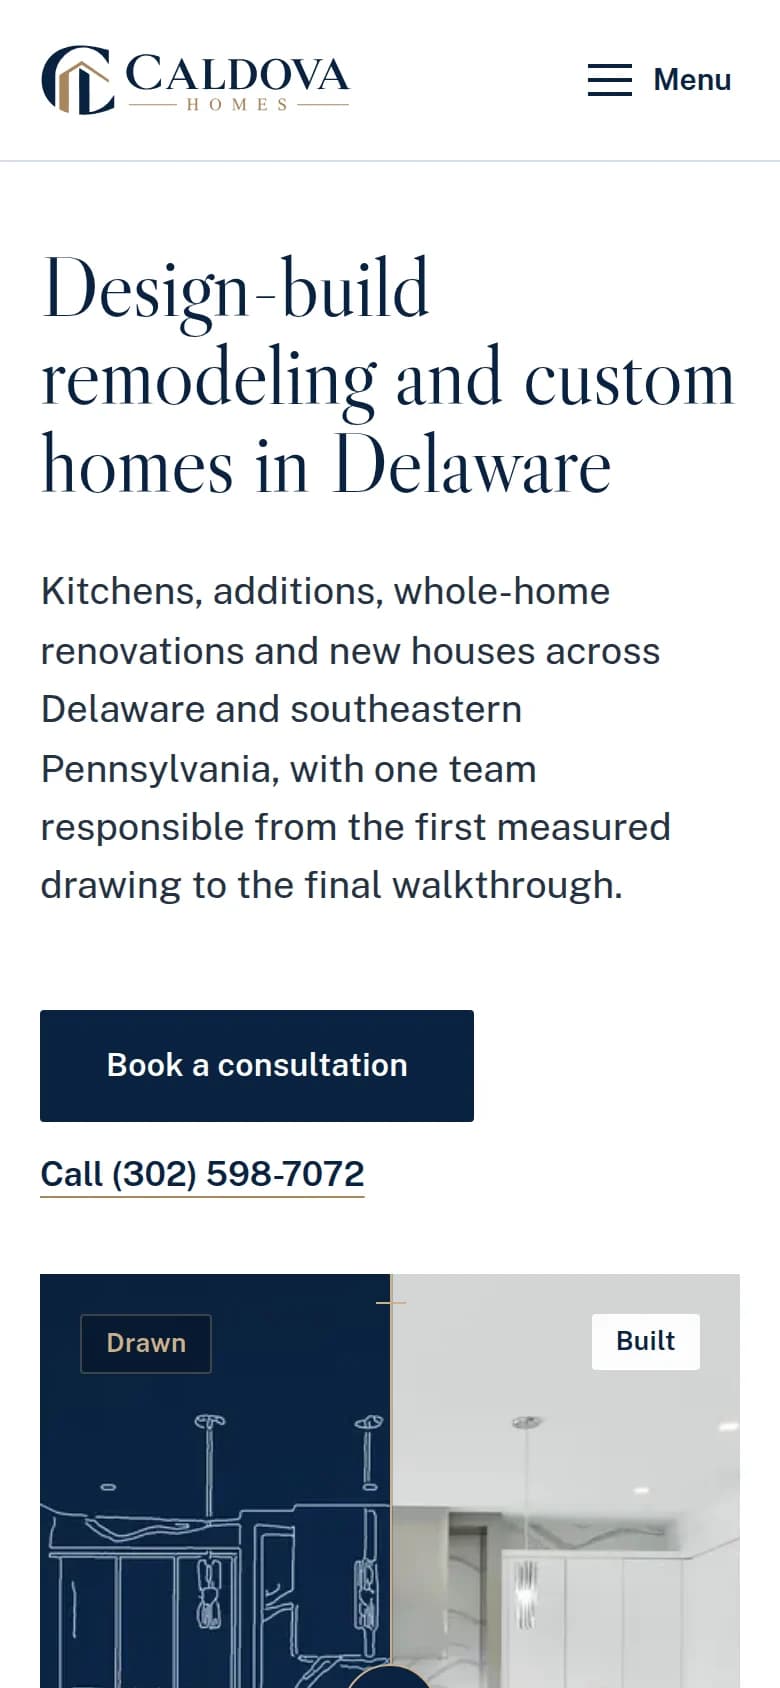

Kitchen & bathroom remodeling
- USA: Delaware & Pennsylvania
- Facebook Ads
53
leads from ads at $19.95 each



Roofing & siding
- USA: Des Moines, Iowa
- Google Ads
25
qualified leads a month within 60 days
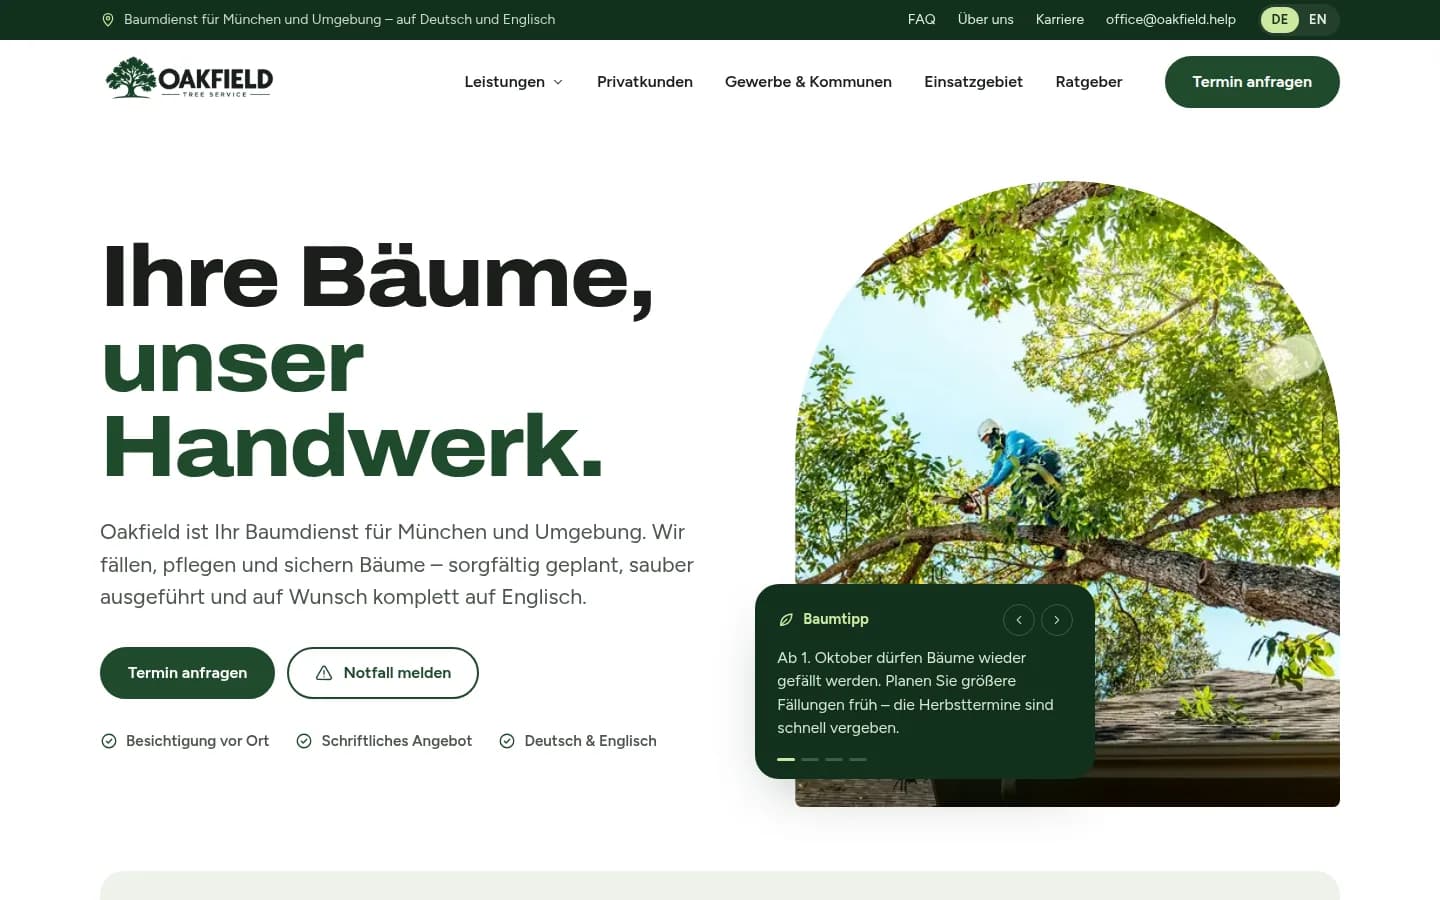

Tree care
- Germany: Munich
- Google Ads
- Meta Ads
- SEO
150–210
leads a month planned by month 5
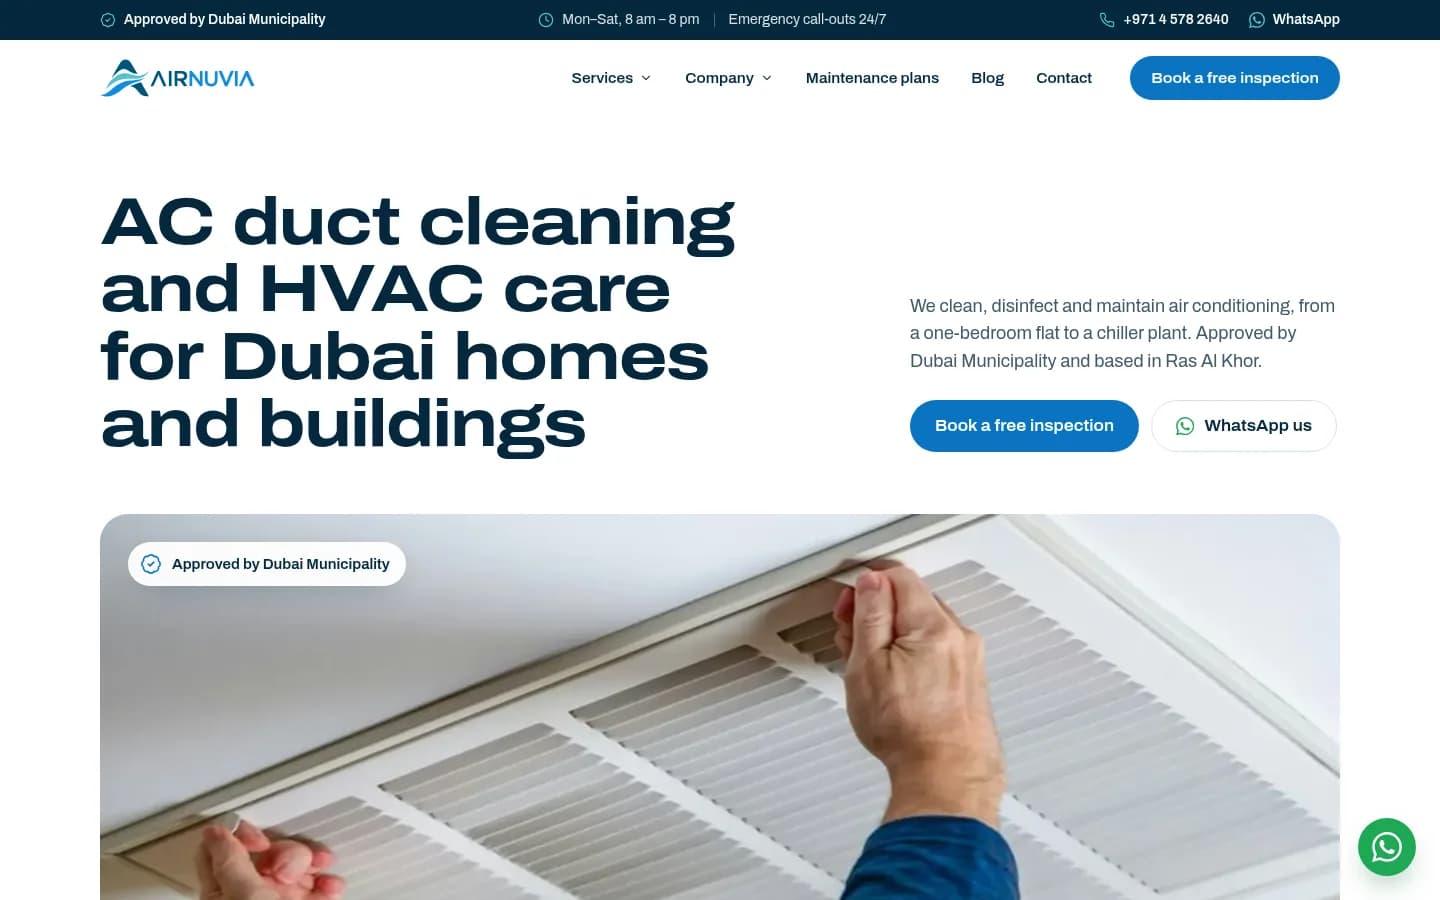

AC maintenance
- UAE: Dubai
- Google Search
- YouTube
- SEO
3–4
calls and inquiries a day from search